See TableBI on real data before you connect anything
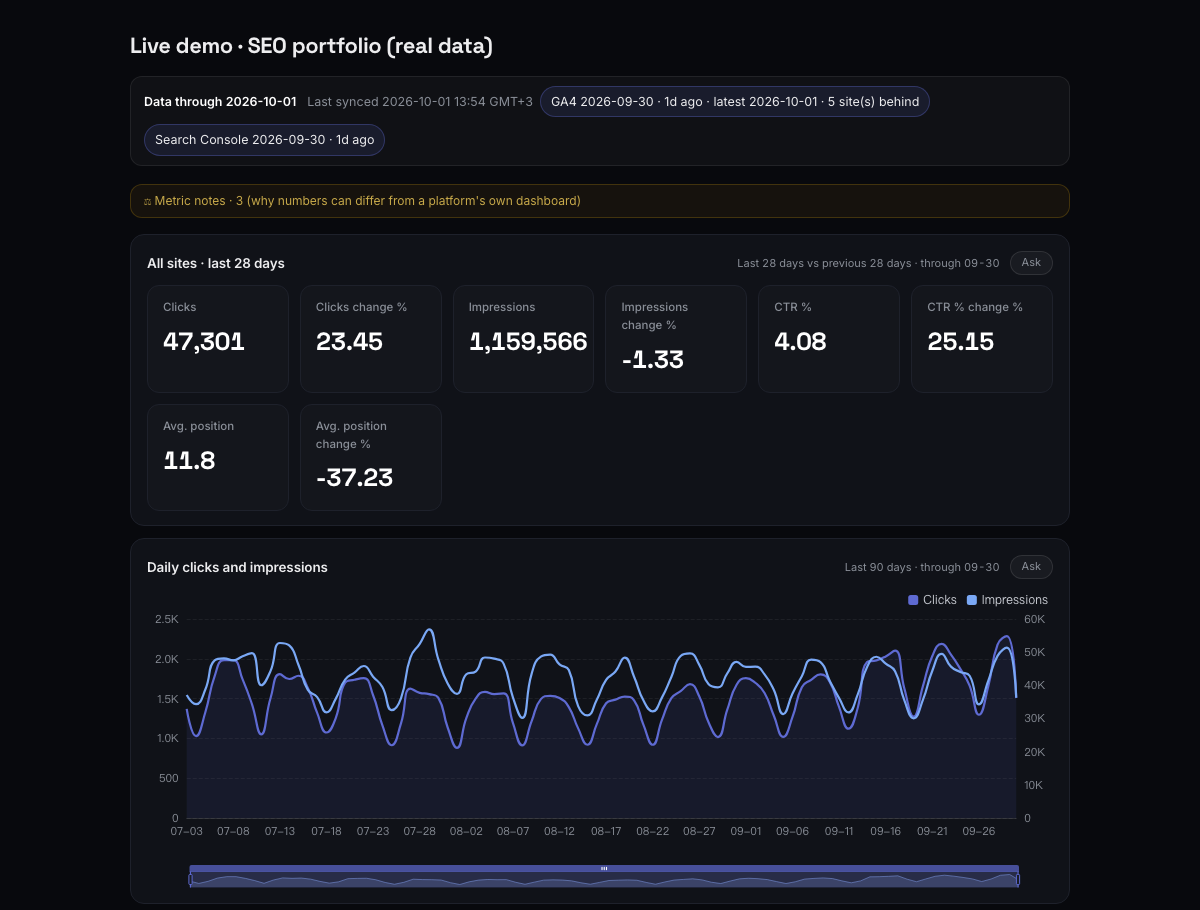
The demo below is a live TableBI dashboard on real Google Search Console data from the TableBI founder's own portfolio of websites. It is not sample data and it is not your data. It shows site-level totals only — clicks, impressions, click-through rate and average position for each site — and it recomputes from the same sync pipeline every workspace uses each time someone opens it. Anyone can open it without an account. Your own data never appears here: it lives in your workspace and stays private unless you publish a dashboard yourself.
Below the dashboard, two walkthroughs show the steps you would take with your own accounts — finding content opportunities in Search Console, and reading channels in Google Analytics 4 — with the exact prompts, the commands your agent runs, and what comes back.
- Real data · Google Search Console
- Whose · the founder's own sites
- Scope · site-level totals only
- Freshness · recomputed when opened
- Access · public, read-only
What is real here, and what is not
| What you are looking at | Data | Who can see it |
|---|---|---|
| The live demo dashboard | Real Search Console data from the founder's own sites, site-level totals | Anyone with the link |
| The animation on the home page | Illustrative numbers written for the animation | — |
| Your workspace | Your own connected sources | Only you |
| A dashboard you publish | The queries you pinned, recomputed from your data when opened | Anyone with its link, until you unpublish it |
Walkthrough 1: find content opportunities in Search Console
The question: which searches already show your pages but sit just off page one, where a better page or a few internal links could turn impressions into clicks.
1. Connect Search Console
Your agent runs one command. A browser tab opens Google's consent screen asking for read-only Search Console access (the webmasters.readonly scope). While TableBI's Google verification is in review, Google first shows a "This app isn't verified" screen: choose Advanced, then continue to console.tablebi.com. If your Google account has several verified sites, the agent lists them and reruns the command for the one you pick. The first sync pulls 16 months of site totals and the last 90 days of pages and queries; --days reaches further back.
tablebi connect gsc --site sc-domain:example.com
2. Ask in plain words
"Which non-brand queries get impressions but rank between 8 and 30?" The agent turns that into a grammar query, so the tables, date window and brand filter are chosen by the engine rather than improvised:
tablebi query --kind table --view search_console \
  --metrics impressions,clicks,avg_position --by query \
  --filter "query_not=yourbrand*,site:*" --limit 25 --json
3. Read the answer, with its caveat
The reply carries one row per query — query, impressions, clicks, average position — together with the time window it covers (by default the last 28 days that have data, not the last 28 calendar days), the SQL the engine generated, and a caveat that matters: per-query rows exclude the anonymized queries Google withholds, so they add up to less than the site total. The agent is instructed to pass that caveat on with the numbers.
4. Pin it as a live dashboard
"Pin that, with a weekly impressions trend on top." The agent writes a small dashboard file and publishes it. The result is a read-only URL that re-runs its queries when someone opens it, so next week's link shows next week's numbers.
tablebi dashboard publish --file opportunities.json
✓ Published: https://<your-workspace>.tablebi.com/d/dsh_…
Walkthrough 2: which GA4 channel actually converts
The question: comparing this month with last month, which default channel group brings sessions that convert — and is any of it coming from AI assistants?
1. Connect GA4
Same pattern: tablebi connect ga4 opens Google's consent screen for read-only Analytics access (analytics.readonly), then lists your properties. TableBI syncs sessions, users, page views, key events (shown as conversions) and revenue by date, channel and country, plus source × medium and the landing pages of AI-assistant visits.
2. Ask
tablebi query --kind compare --view ga4 --metrics sessions,conversions --by channel --json
tablebi query --kind trend --view ga4 --metrics sessions --filter ai_only \
  --split-by ai_assistant --window last-90d --grain week --json
3. Read the answer
The first reply puts each channel's sessions and conversions for both periods side by side with the change in percent; the second gives weekly sessions from ChatGPT, Perplexity, Claude, Gemini and similar assistants. GA4 keeps processing the most recent 24 to 48 hours, so the newest day can still move, and GA4 "conversions" here are the property's key events.
4. Pin and share
Pinned the same way, the channel table and the AI-referral trend become one link you can send to a client or a co-founder, who can open it without an account.
What the demo will not show you
- Four live sources plus CSV. Search Console, GA4 and Google Ads are live; Meta Ads is in beta, and until Meta's App Review completes only people added to our Meta app as test users can connect it. Other channels come in as CSV uploads.
- Campaign level for ads. Google Ads and Meta Ads sync at campaign level, not ad group or keyword.
- No reporting-agency features. No white-label, scheduled PDF or email reports, alerts or rank tracking.
- Free plan. One source and one live dashboard. The $29-a-month Operator plan is switched on by request during early access, as the pricing page explains.
Other products also put AI and shareable live dashboards on marketing data — Supermetrics Studio, for one, in beta since July 2026. What is different here is narrower: the reasoning runs in an agent you already use, against read-only SQL tables you can inspect, with nothing installed on your website.
Start with your own data
Use Claude Code or Codex
Paste the setup prompt into your agent. It installs the CLI, signs you in and connects your first source.
Start in the browser
Sign in with Google, connect a source and get an overview dashboard built for you — no terminal needed for that part.
Install the Claude Code plugin
/plugin marketplace add cooldk/tablebi-plugin, then /plugin install tablebi@tablebi.
Set up TableBI as my Claude Code's data backend — so you can connect my marketing sources, query them, and publish live dashboards for me.

1. Install:  npm i -g @tablebi/cli
2. Run tablebi install — it adds the tablebi skill so you'll know to use these commands next time.
3. Run tablebi login — it opens the browser to authorize; the first login also creates my account. Walk me through it.
4. Run tablebi context — confirm you're connected and show my sources + metric definitions.

Then tell me what's ready — always read the numbers from the CLI (never invent them), and ask before spending money or emailing a real person.
The step-by-step reference for every command is in the docs. Guides for the most common jobs: Facebook Ads to Looker Studio, Search Console to Power BI, GA4 in Claude Code and exporting more than 1,000 rows from Search Console.
Questions people ask
Is the TableBI demo real data?
Yes. The live demo dashboard runs on real Google Search Console data from the TableBI founder's own websites, synced by the same pipeline every workspace uses. It shows site-level totals only — clicks, impressions, click-through rate and average position per site — and it recomputes from current data each time it is opened.
Do I need an account to see the demo?
No. The demo dashboard is a public, read-only link. You need an account only to connect your own sources; signing in with Google creates one, and the free plan covers one source and one live dashboard.
Will my own data be public if I connect it?
No. Connected data stays in your workspace. A dashboard becomes a public link only when you publish it, and unpublishing takes the link down. The demo shows the founder's data, never a visitor's.
Why does Google say the app is not verified?
TableBI's Google OAuth verification is still in review, so Google shows a "This app isn't verified" screen before the consent page. Choose Advanced, then continue to console.tablebi.com. The Search Console and GA4 permissions TableBI asks for are read-only, and you can revoke access at any time in your Google account.
Do I need Claude Code to use TableBI?
Not to get started. You can sign in on the web, connect a source in the browser and get an automatically built overview dashboard. Asking new questions and pinning your own dashboards happens through TableBI's command-line tool, which an agent such as Claude Code or Codex drives for you.
Sources, read October 1, 2026: OAuth scopes from Search Console API authorization and GA4 Data API; Google's unverified apps page; key events in Analytics Help. Product limits from TableBI's capability list.